

More bearish news for corn today as the USDA released its Crop Production report. Ending and world stocks reported much higher numbers than estimates suggested.
| Corn Stocks – USDA Report May 10, 2019 | |||
| Actual | Average | Range | |
| 2018/19 US Ending Stocks | 2.095 | 2.055 | 2.011-2.135 |
| 2018/19 World Stocks | 325.94 | 316 | 314-318.2 |
| 2019/20 US Ending Stocks | 2.485 | 2.131 | 1.787-2.387 |
| 2019/20 World Stocks | 314.71 | 304.71 | 271.2-322 |
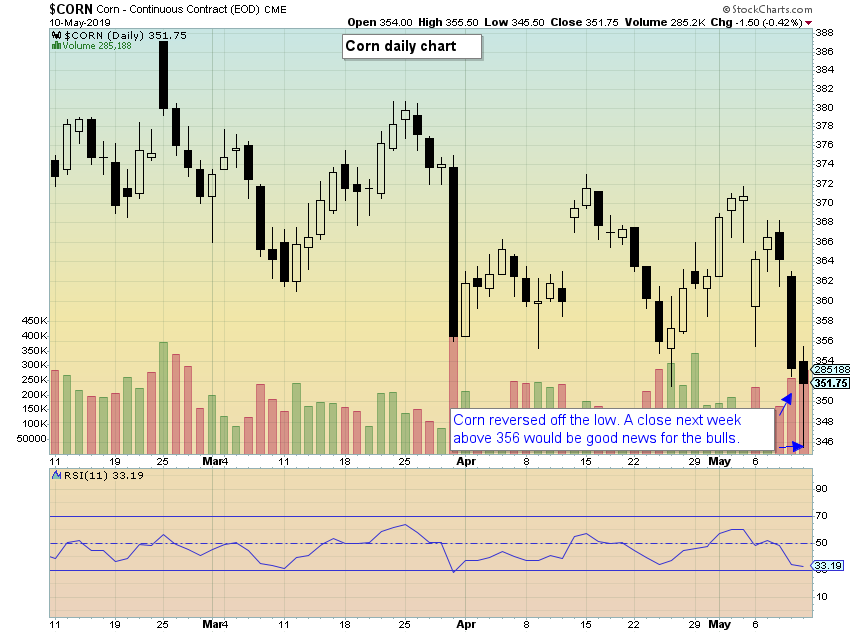
July corn prices dropped to 345 ½ directly after the report was released, however, unlike the March report – which greatly missed estimates and corn prices fell over 4.5% that day – today prices rebounded off the low, closing down by only -0.85%. Today’s price action pierced the lower trendline, reversed and closed above the support, leaving a bullish looking candlestick on the daily chart.
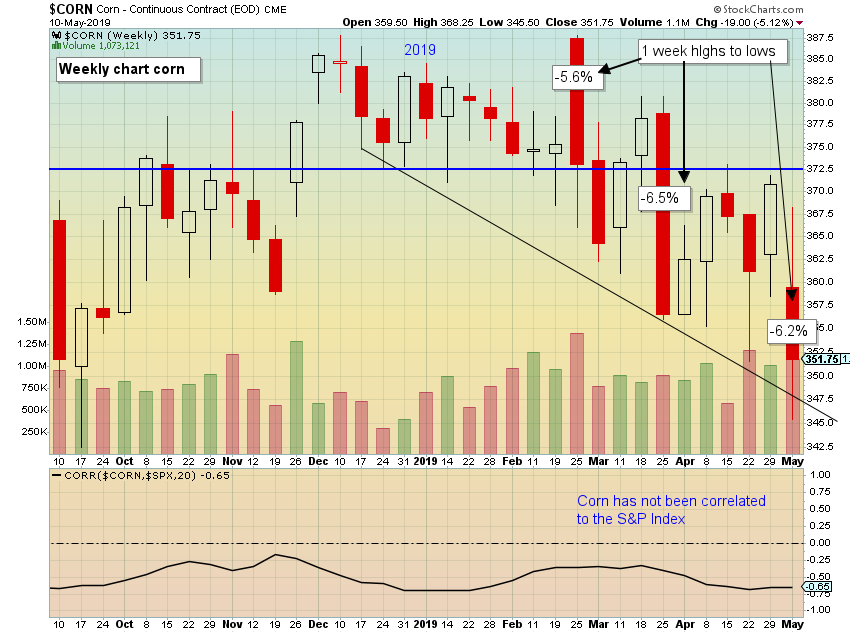
If comparing to the equity markets, a nearly 1% one-day drop may sound like a large move, however, corn prices have been in a volatile downtrend this year. On the continuous corn futures price chart, corn ended 2018 at 383. Today’s close was just above 350, a decline of -8.6% since the beginning of the year, and nearly -10% lower than March’s high. Year to date, corn has had three -5% or more declines from high to low (see chart).
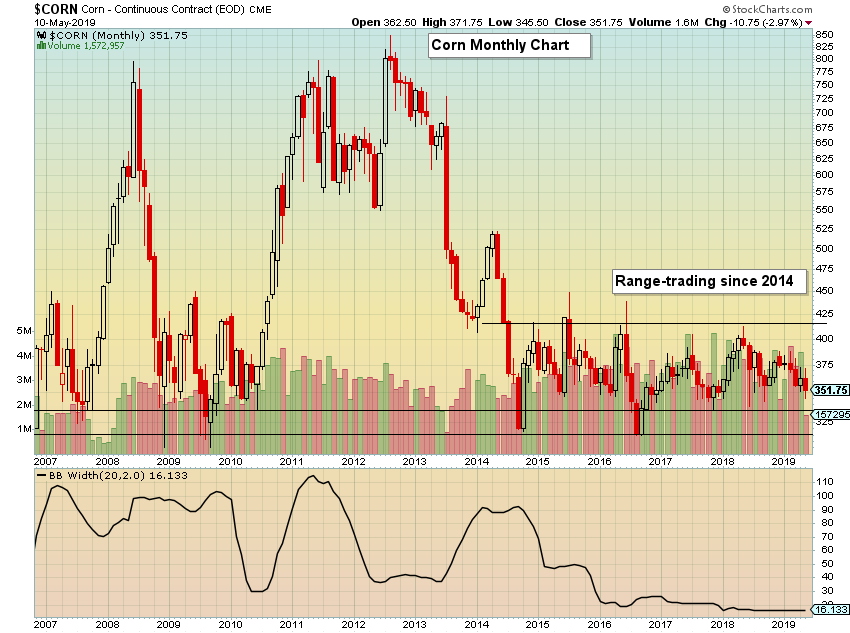
I find the long-term monthly corn price chart interesting. Corn has traded in a fairly tight range since 2014, which is clearly demonstrated on the price chart and the Bollinger Band Width. Monthly support levels come in at 335 and a much lower price near 315. With corn stock estimates so high, it will be interesting to see if corn will revisit that lower level which has only been seen a handful of times in the past 12 years, or if the record short futures position will reverse and bring some buying back into the market.
Two other items I’d like to point out how this year is not following suit with corn’s “typical” behavior.
- As price has declined, volatility has risen, which is opposite of what is normally seen.
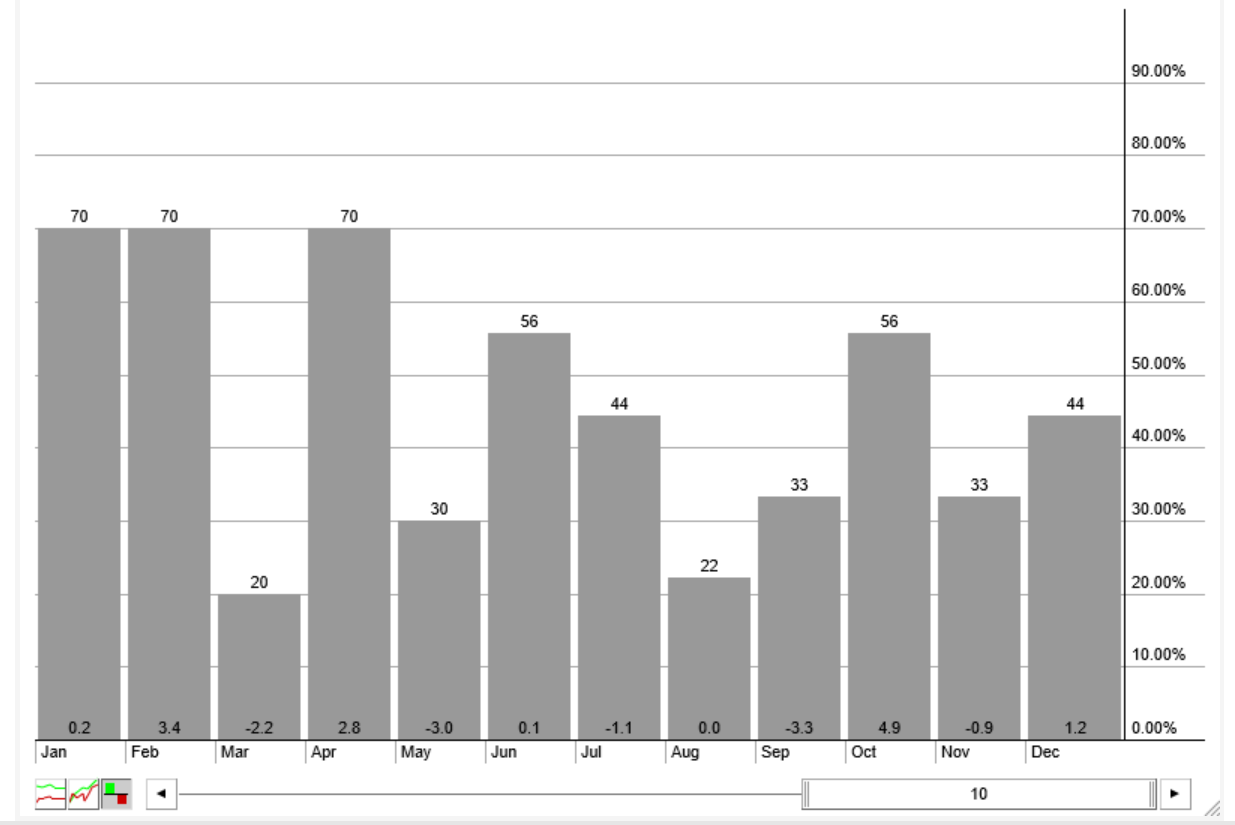
- Corn price strength is not unusual early in the year (Jan, Feb, and Apr have closed higher 70% of the time over the past 10 years).
A headline today from the AG Web Farm Journal reads “Bearish USDA Report Could Help Corn Prices Bottom Sooner”. It’s difficult to think that we are looking for a bottom in May. It seems a few months early to have such a headline, but this year has been anything but normal for corn. What event will actually bid prices this year? Will it be a trade deal, weather, issues with the crop, or will prices remain low throughout the year? We’ll have to wait and see.
Disclosure- Author has both long and short positions in corn futures and options.
The post Corn Prices Sink Further After USDA Report appeared first on Catalyst Hedged Commodity Strategy Fund Blog.