

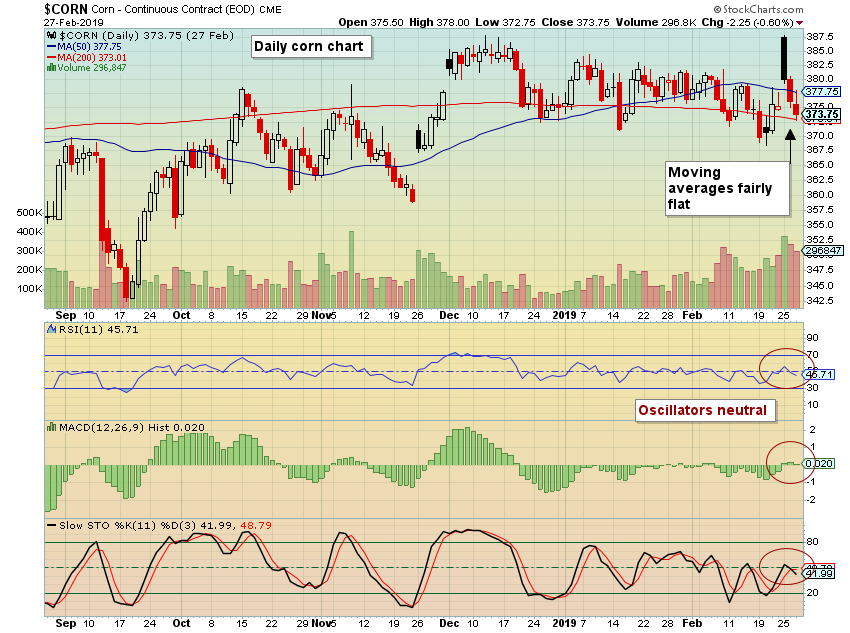
After months of tight consolidation in corn prices, the past 8 days have been very active. Name just about any technical oscillator like RSI, MACD, Moving Averages, Slow Stochastics, CCI, etc.… and you’ll find a near neutral chart. Normally, the Commitment of Traders report would be a reference source, however, the report release schedule since the government shut-down won’t have current reports until almost mid-March. Just looking at price, there was a very tight range, then quick lows-to-highs and back show a 5.2% advance followed by a quick drop of 4.5% to 370, where it is trading as I’m writing.
Searching for any signs of relief to this decline, I did find a few things to note, which I will share.
Regarding the obvious price levels, there is a strong upper resistance near 388 (upper black line) that has been touched numerous times going back to August. A not-as-strong support is marked near 359 (lower black line) where it touched in July & Nov. A gap from 362-367 (blue lines) is between the support and resistance levels. Price is currently trading very close to the top of that gap.
On the left side is volume by price. This shows a low of volume in the low 370’s. One can see how volume drops off under 365, which could possibly indicate fast trading under that level to the next support. Also, the volume in the latter part of Feb. has been relatively high (bottom right in chart).
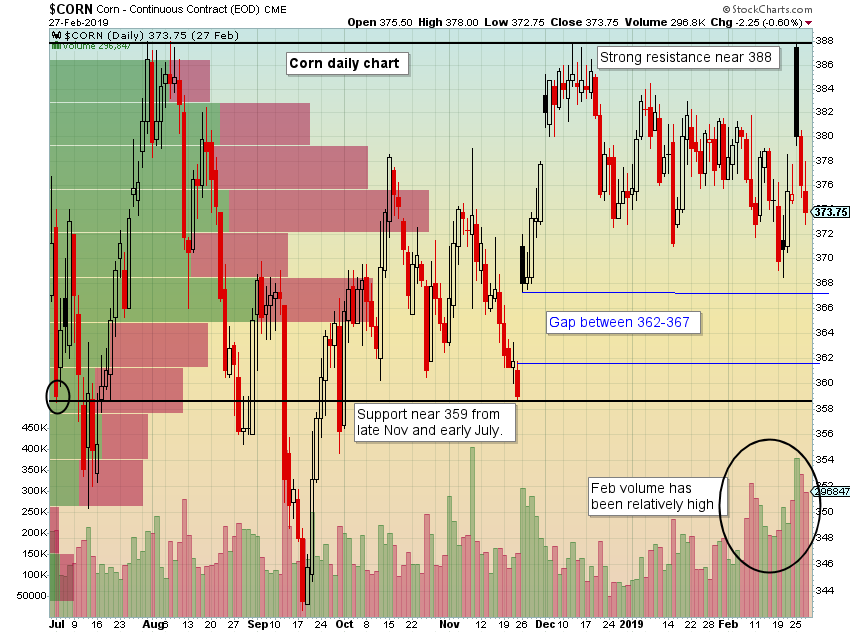
So far, this information just gives us levels and data. The main thing that stands out to me is the recent higher volume on wider price swings. The bulls and bears have been fighting. There is nothing though that seems clear when trying to get a feel for where the market is going.
After much searching, I reviewed the “Ultimate Oscillator” (that’s actually its name), developed by Larry Williams. It is meant to be viewed for divergence patterns. Stockcharts.com gives the definition as:
“Ultimate Oscillator is a momentum oscillator designed to capture momentum across three different timeframes. The multiple timeframe objective seeks to avoid the pitfalls of other oscillators. Many momentum oscillators surge at the beginning of a strong advance and then form a bearish divergence as the advance continues. This is because they are stuck with one timeframe. The Ultimate Oscillator attempts to correct this fault by incorporating longer timeframes into the basic formula. Williams identified a buy signal a based on a bullish divergence and a sell signal based on a bearish divergence.”
When viewing times when the ULT was at 36 or under, one can see that price was nearing a low (below chart, circles and line in blue). Currently, the oscillator is just starting to break the 36 line, so it can definitely go lower. However, it could also be suggesting that the corn price decline is nearing an end. What is uncomfortable about thinking this way is the sharp price sell-offs in the past when the ULT was still declining below 36.
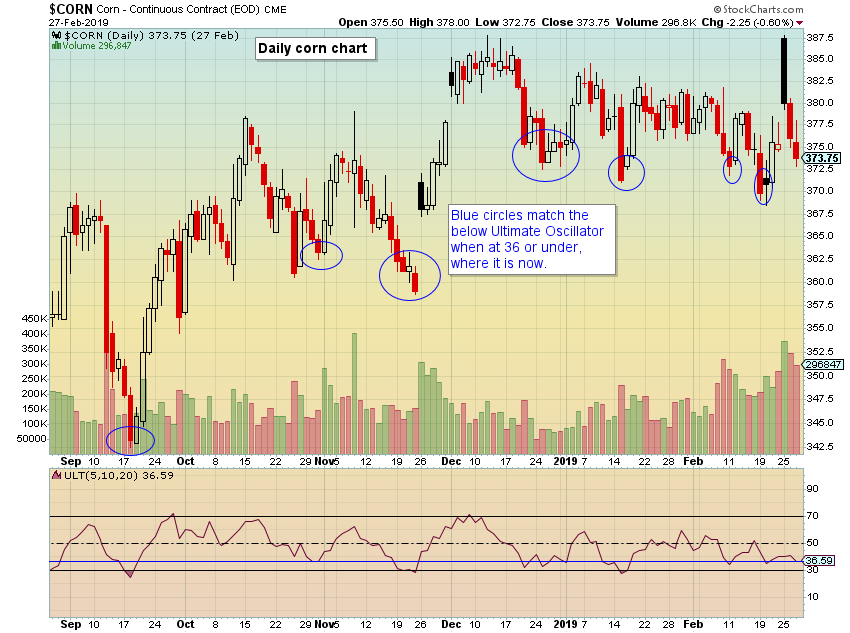
To recap, there is not much to see in the charts, but the ULT Oscillator and gap may be places to look for a bottom, or at least pause. Tread lightly.
Within our office, we’ve looked back to see corn price differences from the last trading day in Feb. to the last trading day in May. The corn prices used are from Investing.com, going back to 1980. On average, corn prices are positive a with a median of 3.95%. The ranges are large though.
| Year | EOM Feb – EOM May Return | Year | EOM Feb – EOM May Return | Year | EOM Feb – EOM May Return | ||
| 1980 | 4.73% | 1993 | 6.27% | 2006 | 10.20% | ||
| 1981 | -2.16% | 1994 | -2.36% | 2007 | -8.23% | ||
| 1982 | 7.11% | 1995 | 13.55% | 2008 | 10.31% | ||
| 1983 | 11.74% | 1996 | 21.83% | 2009 | 24.38% | ||
| 1984 | 8.43% | 1997 | -8.76% | 2010 | -4.99% | ||
| 1985 | 3.88% | 1998 | -8.80% | 2011 | 3.46% | ||
| 1986 | 3.95% | 1999 | 7.33% | 2012 | -15.03% | ||
| 1987 | 28.18% | 2000 | 6.13% | 2013 | -7.99% | ||
| 1988 | 11.71% | 2001 | -10.14% | 2014 | 1.80% | ||
| 1989 | -4.31% | 2002 | 6.73% | 2015 | -8.58% | ||
| 1990 | 12.55% | 2003 | 5.39% | 2016 | 14.17% | ||
| 1991 | 1.87% | 2004 | 2.62% | 2017 | 1.43% | ||
| 1992 | -1.98% | 2005 | 3.50% | 2018 | 5.21% |
Best and worst performing years:
| Year | Best EOM Feb – EOM May Return |
| 1987 | 28.18% |
| 2009 | 24.38% |
| 1996 | 21.83% |
| 2016 | 14.17% |
| 1995 | 13.55% |
| 1990 | 12.55% |
| 1983 | 11.74% |
| 1988 | 11.71% |
| 2008 | 10.31% |
| 2006 | 10.20% |
| Year | Worst EOM Feb – EOM May Return |
| 2012 | -15.03% |
| 2001 | -10.14% |
| 1998 | -8.80% |
| 1997 | -8.76% |
| 2015 | -8.58% |
| 2007 | -8.23% |
| 2013 | -7.99% |
| 2010 | -4.99% |
| 1989 | -4.31% |
| 1994 | -2.36% |
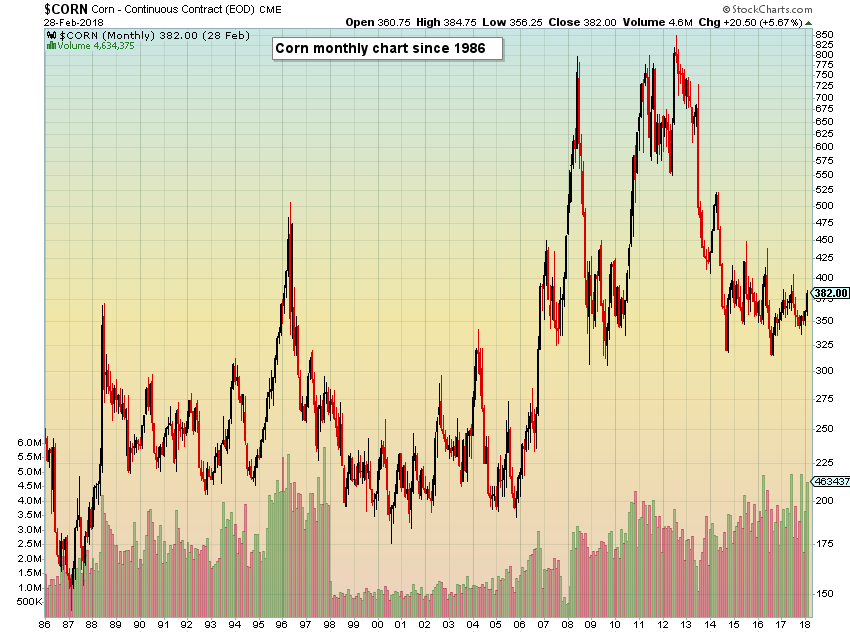
To put the years into perspective, below is a monthly corn continuous contract chart since 1986 through Feb. 27, 2019.
These are just some of my thoughts from reviewing the corn charts. With the trade talks keep getting pushed further in time, lack of CoT reports and a few months of a tight trading range, corn has been a difficult read this winter. Soon decisions will be made, reports will be back on track, and hopefully some clarity will come back into the charts. Good luck trading or being patient in the meantime.
The post Corn Charts – The Bears May be Getting Tired appeared first on Catalyst Hedged Commodity Strategy Fund Blog.