

Following several years of strong issuance of convertible securities, many investors are digging in to learn more about the unique characteristics of an instrument that can offer both offense and defense. Convertible securities combine equity and debt features, allowing investors to participate in potential equity price appreciation while offering more limited downside risk provided by the debt feature. The Pier 88 Investment Team is constructive on the convertible bond asset class given a historically high Sharpe ratio, competitive yield and higher position in the capital structure relative to equities, risk-reward profile, and a plethora of new issuances allowing for a diversified portfolio to express thematic views.
As the asset class has a historically high Sharpe ratio, Pier 88 believes a fundamental “equity lens” approach provides a method to uncover compelling investment opportunities in the current macroeconomic environment. By focusing on the underlying equity element of this hybrid security and concentrating on “delta”, a main driver of returns, Pier 88 posits that convertible allocation can be a compelling way for investors to improve risk/return characteristics for investors. Essentially, this equity sensitive characteristic enables an active manager to add alpha via security selection. Further, the asset class may be a way to provide some downside protection for those equity investors who seek to be a little more conservative following a multi-year bull market run in equities.
Convertibles as an Asset Class
The convertible asset class is often overlooked and underfollowed. While convertible securities have been issued for over 100 years, investors continue to debate whether it should be an asset allocation from an equity or fixed income viewpoint.
A convertible asset is a hybrid security with debt-and-equity-like features. For example, a traditional convertible bond may have a lower coupon rate than a non-convertible bond issued by the same company. However, it offers the holder the potential upside of conversion into the equity while offering some downside protection through coupon payments and return of principal upon maturity. A holder can convert the bond into a specified number of shares of common stock or cash of equal value.
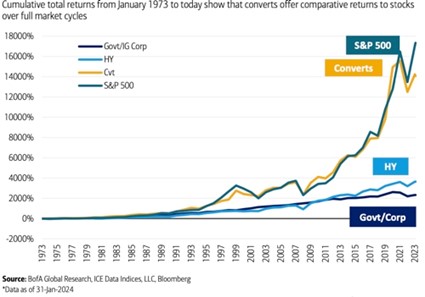
Most convertible bonds reside in the capital structure with traditional fixed income securities. Since 1973 cumulative total returns suggest that converts offer comparative returns to stocks and superior to high yield bonds over full market cycles while offering better yield and holding a superior position in the capital structure over equities.
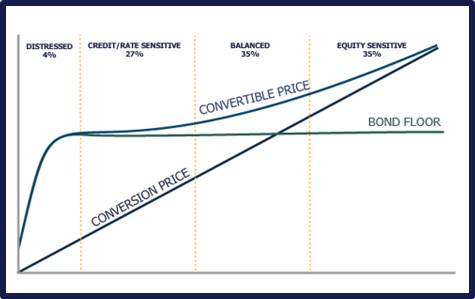
Convertible bonds have convexity through an embedded call option offering upside participation in market rallies and the bond floor providing protection in the event of a decline. Below is a classic depiction of the return profile for a convertible bond.
The market has been fairly receptive to companies bringing convertible bonds from sectors such as technology, consumer, healthcare and real estate.
The broader convertible bond market is approximately $354bn and diversified across a range of sectors and market caps. The following chart depicts a current snapshot of the market.
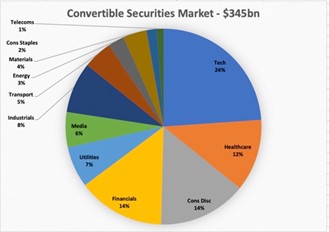
Source: Pier 88, Bloomberg, ICE Data Indices, LLC, BofA Global Research, Data as of 31-Jan-2024
Strong Returns & High Sharpe Ratio
A review of almost 30 years of data comparing the risk/reward attributes of several asset classes including government bonds, high yield bonds, convertibles and equities paints an interesting picture. The convertible bond asset class tends to have a strong Sharpe ratio and strong relative returns. The table below displays these findings.[1]
[1] Pier 88 / Bloomberg/ICE Data Indices, LLC./BofA Global Research. Data from 31-Dec-1996 to 31-Jan-2024. Based on total return time series.
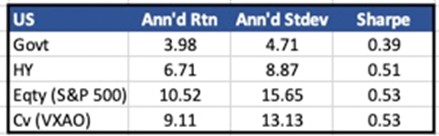
Source: Pier 88/Bloomberg/ ICE Data Indices, LLC./BofA Global Research. Data from 31-Dec-1996 to 31-Jan-2024
The data is compelling – equity-like returns, less volatility.
As mentioned, convertible assets are a hybrid with both equity and fixed income characteristics and have often been overlooked in favor of high yield or equity allocations. Given its unique complexity, convertibles often trade at a discount to their fixed income counterparts.
Delta measures the change in the convertible assets’ price with respect to the change in the underlying common stock price. Delta usually increases as the underlying stock price increases and will move to 1.0 (or 100%) as the convertible becomes deep in the money. If a convertible asset trades at a 1.0 delta, the change in the convertible bond price becomes highly correlated to the change in the underlying stock price. Conversely, as the convertible assets move out of the money the delta will decline towards zero.
The following chart details the current break down of delta sensitivity across the US convertible market.
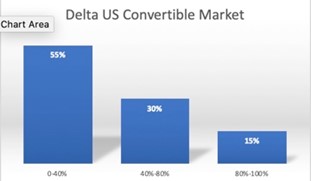
Source: Pier 88/ ICE Data Indices, LLC./BofA Global Research. Data as of 31-Jan-2024
As the above chart suggests, the returns of almost have of the securities in this asset class will be heavily influenced by the moves in the underlying equities. Pier 88 posits that this phenomenon provides a backdrop wherein an investment manager can add value via security selection.
Issuers of convertibles are well distributed across large, mid and small cap with a market cap range. In the US market, approximately half of the convertibles have been issued by companies with market caps of $10bn+, a little over a third by companies with markets caps in the range of $2-$10bn, and the remaining 16% by companies with market caps less than $2bn.[1]
The “Equity Lens” Approach
As convertible bonds are hybrid securities blending equities and debt, there are multiple approaches to managing convertible bonds. Some may focus on the credit aspects of the market, while others focus on the structure of a particular security. In this market our view is that the delta, or “equity sensitivity” of the security, is the primary driver of returns. As the charts above show, delta has driven most of the performance of convertible bonds.
While credit research and understanding the structure of a convertible security is important, Pier 88 believes getting the investment call right on the underlying equity of an issuer is critical.
The data suggests that the equity sensitivity has driven the upside performance while the fixed income characteristics enabled superior performance on the downside.
The case for an allocation to convertible bonds continues to be strong and the case for active management in this space even stronger. Employing a fundamental “equity lens” approach can uncover compelling investments in the current macroeconomic environment. Convertibles securities can likely offer diversification to lower overall portfolio volatility. A convertible bond allocation may be a differentiated way for investors to achieve performance from the traditional fixed income and high dividend equity investment. Convertible coupons provide a more dependable income stream compared to equity dividends. The bond “floor” or par value can also provide some downside protection for those equity investors who seek to be a little more conservative following a multi-year bull market run in equities.
The Pier 88 Investment Team is constructive on the convertible bond asset class given a historically high Sharpe ratio, competitive yield, risk-reward profile, and a plethora of new issuances allowing for a diversified portfolio. After the rebound in equity markets last year, we see convertible securities as a particularly compelling investment opportunity in the current market environment as they provide the potential for equity participation with the added downside protection of better credit profiles.
Disclosures
This presentation is not an offer to sell securities of any investment fund or a solicitation of offers to buy any such securities. Securities of Pier 88 (the “Fund”) are offered to selected investors only by means of a complete offering memorandum and related subscription materials which contain significant additional information about the terms of an investment in the Fund (such documents, the “Offering Documents”). An investment in any strategy, including the strategy described herein, involves a high degree of risk. There is no guarantee that the investment objective will be achieved. Past performance of these strategies is not necessarily indicative of future results. There is the possibility of loss and all investment involves risk including the loss of principal. Securities of the Fund are not registered with any regulatory authority, are offered pursuant to exemptions from such registration, and are subject to significant restrictions.
The graphs, charts and other visual aids are provided for informational purposes only. None of these graphs, charts or visual aids can of themselves be used to make investment decisions. No representation is made that these will assist any person in making investment decisions and no graph, chart or other visual aid can capture all factors and variables required in making such decisions.
Performance results of convertible bonds is presented for information purposes only and reflect the impact that material economic and market factors had on the manager’s decision-making process. No representation is being made that any investor or portfolio will or is likely to achieve profits or losses similar to those shown. References to market or composite indices, benchmarks, or other measures of relative market performance over a specified period of time are provided for information only. Reference or comparison to an index does not imply that the portfolio will be constructed in the same way as the index or achieve returns, volatility, or other results similar to the index. Indices are unmanaged, include the reinvestment of dividends and do not reflect transaction costs or any performance fees. Unlike indices, the Fund will be actively managed and may include substantially fewer and different securities than those comprising each index.
Russell 2000 Index (RTY): The Russell 2000 Index measures the performance of the small-cap segment of the U.S. equity universe. The Russell 2000 Index is a subset of the Russell 3000® Index representing approximately 8% of the total market capitalization of that index. It includes approximately 2,000 of the smallest securities based on a combination of their market cap and current index membership.
S&P 500 Index (SPX): The S&P 500 focuses on the large-cap sector of the market; however, since it includes a significant portion of the total value of the market, it also represents the market. Companies in the S&P 500 are considered leading companies in leading industries.
BofA Merrill Lynch Bond Indices (VXA0 / VX5C): Source BofA Merrill Lynch, used with permission. Source BofA Merrill Lynch, used with permission. BOFA Merrill Lynch is licensing the BOFA Merrill Lynch indices “As Is,” makes no warranties regarding same, does not guarantee the suitability, quality, accuracy, timeliness, and/or completeness of the BOFA Merrill Lynch indices or any data included in, related to, or derived therefrom, assumes no liability in connection with their use, and does not sponsor, endorse or recommend Pier 88 Investment Partners LLC, or any of its products or services. The BofA Merrill Lynch All U.S. Convertibles Index (VXA0) measures the return of all U.S. convertibles. The BofA Merrill Lynch Investment Grade US Convertible 5% Constrained Index (VX5C) Index is a market capitalization-weighted index of domestic corporate convertible securities.
Bloomberg Barclays US Government/Credit Bond Index: The Bloomberg Barclays US Government/Credit Bond Index is a broad-based flagship benchmark that measures the non-securitized component of the US Aggregate Index. It includes investment grade, US dollar-denominated, fixed-rate Treasuries, government related and corporate securities.
[1] Pier 88/ICE Data Indices, LLC./BofA Global Research. Data as of 31-Jan-2024