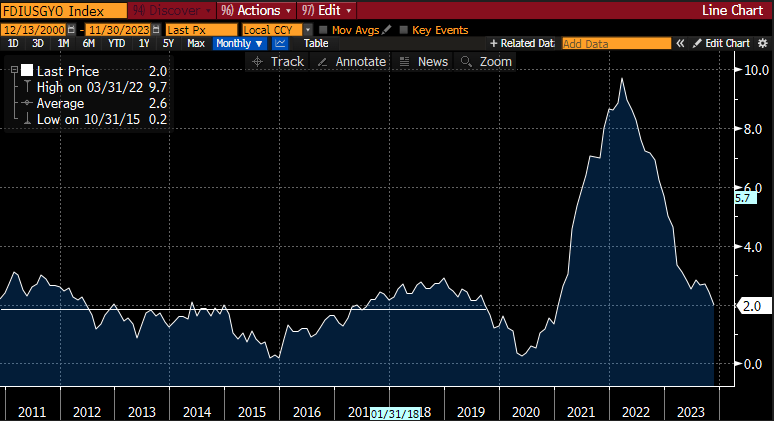
The producer price index (PPI) release, which generally reflects wholesale prices and ultimately feeds into consumer prices, was below estimates on all fronts this morning (including core). The PPI is now at its lowest level in years (as shown below). The PPI feeds into the personal consumer expenditure (PCE) report – the Fed’s preferred inflation gauge.


The PPI data indicate there are a lot of disinflation or deflation in many categories in the economy.
Yesterday’s Consumer Price Index (CPI) report, which showed a year-over-year 3.1% inflation rate, provides more than just what the headline indicates. When you analyze the data, you’ll notice the CPI core (ex-housing) is running below 2% annualized, but it’s important to keep in mind that these calculations are up to three quarters behind the current reality.
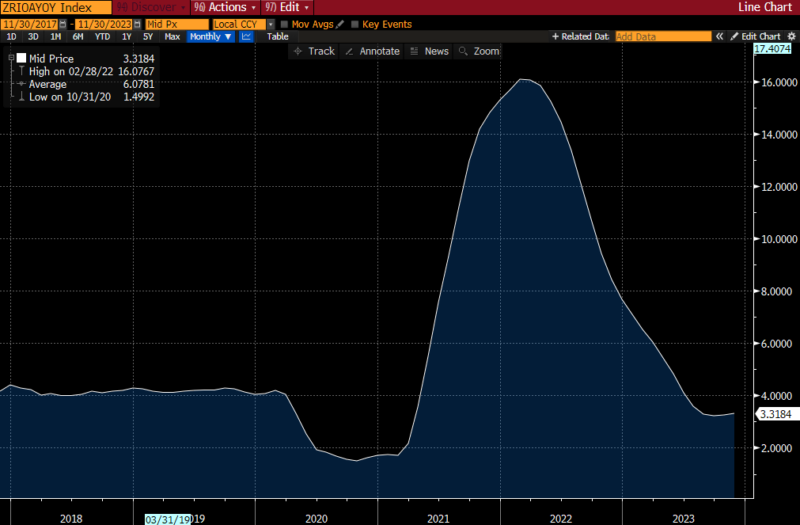
In looking at U.S. median asking rents, a recent Redfin report indicates a 2.1% year-over-year decline – the biggest annual drop since February 2020. It’s also very easy to see the change in real rent numbers, as indicated on Zillow’s rent chart:

For those afraid of a repeat of the 1970’s, this is not the 1970’s. Oil prices spiked 17X during that time period of hyperinflation; that would imply oil needing to rise to approximately $1,200 a barrel to create that type of inflation. For context, WTI is currently trading below $70.
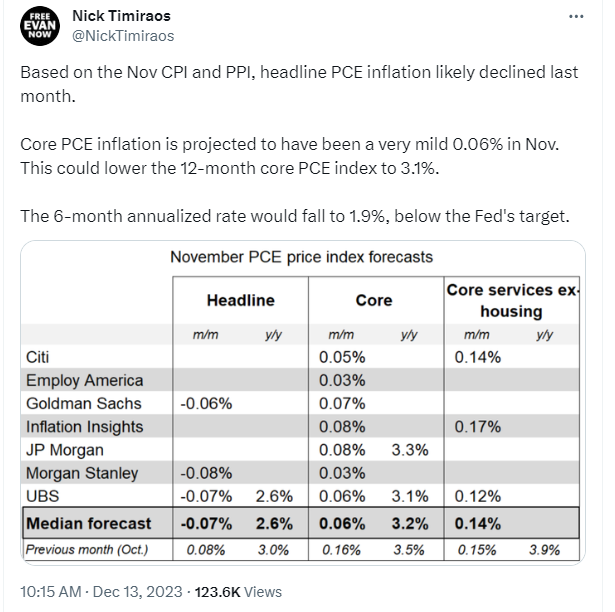
See more context below from Nick Timiraos, Chief Economics Correspondent at the Wall Street Journal, who shared his thoughts this morning on X (formerly known as Twitter):

In short, we have essentially reached the Fed’s target.

