Trade talk updates between the U.S. and China have had agriculture prices bouncing up and down lately. Much of the news has been focused around soybean purchases, which pull corn prices up temporarily. However, the gains have not been able to hold, nonetheless.
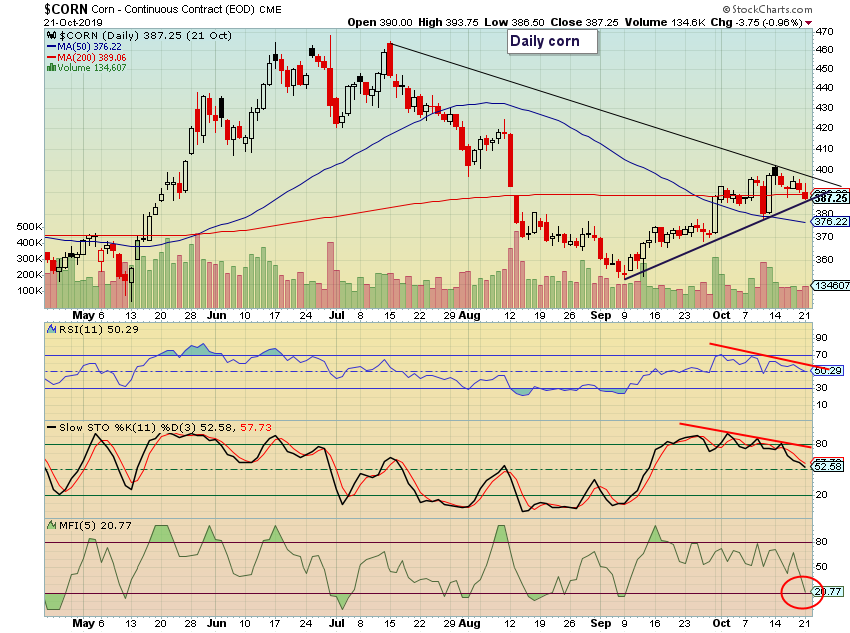
The daily corn chart below has a few interesting features.
- Daily prices show how corn has been weakening throughout the day recently. Five of the last six daily bars have closed below their opens.
- Corn prices have closed below a 50-day moving average.
- The price of corn is testing the support of an apex triangle. As time of this writing, intraday prices are started to break below.
- A potential price target could be the 200-day moving average at 376.
- The relative strength index (RSI) and Slow Stochastics oscillators, which measure price momentum, showed divergence (higher prices with lower oscillator high’s) during the first half of October and now continue downward.
- The Money Flow Index, which is a technical oscillator that combines price and volume for identifying overbought or oversold levels of a particular asset, has lost strength.

One last item that I’d like to point out separate from the chart is that seasonally, this is not a particularly bullish time for corn prices.
This bearish view is just one side of the triangle. A bullish breakout could target the October 14 high of 402.50 and then higher levels. However, the charts are indicating a bearish bias. Seeing that one trade deal announcement mentioning corn could propel prices into the 400s, or lack thereof make prices sink, hedging trades or avoiding certain trades could prove beneficial.


