Navigating the Rate Cut: A Guide for Advisors

Introduction

The ongoing Federal Reserve cycle has sparked intense debate regarding its resemblance to the 2007 and 1998 financial crises. While a definitive answer remains elusive, the devil is indeed in the details. The current economic landscape shares similarities with both 2007 and 1998, but the specific outcomes remain uncertain. The stark contrast between the record-breaking stock market of 1998 and the near-50% decline in 2007 underscores the importance of discerning the underlying factors driving each crisis. However, one consistent element across these periods is the rise in volatility following Federal Reserve rate cuts.
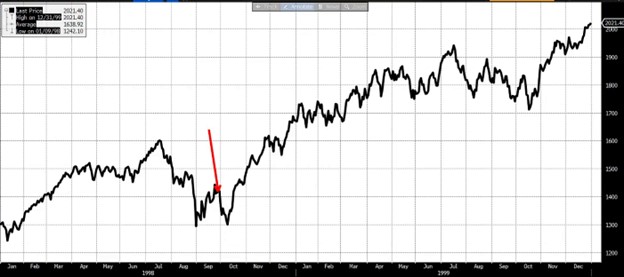
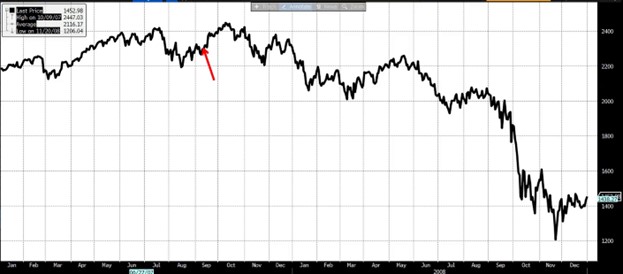
Source: Bloomberg

Historical Context and Current Trends

A recurring pattern emerges in financial markets: a steepening yield curve often coincides with increased volatility. This phenomenon is evident in both 2007 and 1998, as well as other periods of economic downturn.
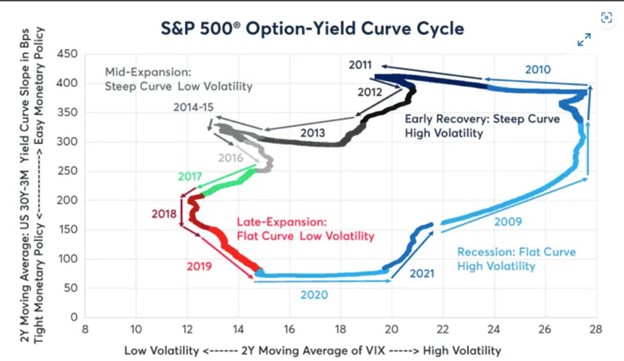
Source: CME Group

  • The Volatility Cycle: The yield curve’s movements often correlate with cyclical volatility patterns. A flat yield curve, typically associated with the end of an economic expansion and higher interest rates, often precedes a period of lower volatility. When the Federal Reserve cuts rates, steepening the yield curve, volatility tends to rise. This peak in volatility often coincides with the steepest point of the yield curve.
  • The 2007 and 1998 Comparison: While both 2007 and 1998 featured a steepening yield curve and rising volatility, the underlying causes differed. In 1998, a volatility shock triggered by the Russian debt crisis prompted the Fed to lower rates. Conversely, in 2007, the Fed’s rate cuts were a response to a deteriorating labor market.


Volatility and the yield curve, often described as mean-reverting, exhibit a similar cyclical pattern of highs and lows.

The Current Landscape

The Federal Reserve’s decision to lower interest rates in 2024, amidst a backdrop of declining inflation and market volatility, raises questions about the similarities and differences to past crises. While the exact trajectory remains uncertain, the rising yield curve and increasing volatility suggest a potential parallel to the many times in history the Yield Curve got steeper.

The visualization below demonstrates the historical pattern: As the yield curve (in black) rises, volatility (in orange) follows suit.
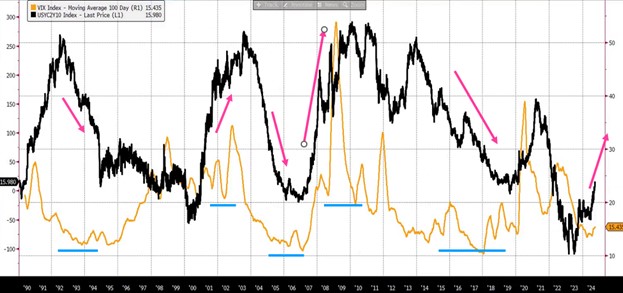
Source: Bloomberg

Conclusion

As the financial landscape continues to evolve, understanding the historical context and current trends is essential for making informed investment decisions. By recognizing the cyclical nature of volatility and leveraging specialized strategies, investors can mitigate risks and protect their portfolios from market downturns.


Latest

My 50-Cents – Fed Analysis from Leland Abrams of Wynkoop, LLC

The Federal Reserve Board cut their benchmark rate this...

A Summer Surge: August 2024 HANDLS Monthly Report

After a challenging July that saw investors sell off high-flying technology stocks, buyers returned to the market in August, bidding up risk assets across the board.

Where are the Hidden Risks in Your Portfolio Currently? Plus, an idea.

Allocators add new exposures for a variety of reasons; diversification, returns, risk mitigation, etc. Understanding this, what is the most over-owned and expensive sector today?

Consumer Spending: Are Consumers Tapped Out or Pushing Back?

Consumer Spending: Are Consumers Tapped Out or Pushing Back?  Key...

Newsletter

Don't miss

My 50-Cents – Fed Analysis from Leland Abrams of Wynkoop, LLC

The Federal Reserve Board cut their benchmark rate this...

A Summer Surge: August 2024 HANDLS Monthly Report

After a challenging July that saw investors sell off high-flying technology stocks, buyers returned to the market in August, bidding up risk assets across the board.

Where are the Hidden Risks in Your Portfolio Currently? Plus, an idea.

Allocators add new exposures for a variety of reasons; diversification, returns, risk mitigation, etc. Understanding this, what is the most over-owned and expensive sector today?

Consumer Spending: Are Consumers Tapped Out or Pushing Back?

Consumer Spending: Are Consumers Tapped Out or Pushing Back?  Key...

Knocked Down Inflation: July 2024 HANDLS Monthly Report

After a red-hot June built on expectations that the Federal Reserve may succeed at killing inflation without killing the economy, July saw investors begin to question the soft-landing narrative.
Joe Tigay, Portfolio Manager
Joe Tigay is Managing Partner at Equity Armor Investments, sub-advisor to a volatility-hedged equity strategy at Rational Funds. Joe began his career in finance as an options market maker with Stutland Equities LLC. in 2005, working on the Chicago Board of Options Exchange and specializing in electronic market making. In 2008, Mr. Tigay became a member trader of the Chicago Board of Options Exchange (CBOE). As a member trader, Joe was a very active market maker in both SPX and VIX options from 2008 to 2012. Discussing options, volatility, and market insight, Joe has appeared on Bloomberg, BNN, and has a regular segment on CBOE.tv. Joe graduated from Michigan State University with a B.A. in Economics. He currently holds licenses for Series 3, 56, 65.

My 50-Cents – Fed Analysis from Leland Abrams of Wynkoop, LLC

The Federal Reserve Board cut their benchmark rate this week by 50 bps to a new range of 4.75% - 5.00%.  They indicated this...

A Summer Surge: August 2024 HANDLS Monthly Report

After a challenging July that saw investors sell off high-flying technology stocks, buyers returned to the market in August, bidding up risk assets across the board.

Where are the Hidden Risks in Your Portfolio Currently? Plus, an idea.

Allocators add new exposures for a variety of reasons; diversification, returns, risk mitigation, etc. Understanding this, what is the most over-owned and expensive sector today?