

- 74-year history of politics and the S&P 500
- Trump’s incentive to not exacerbate the trade war
- The consequences of extreme partisanship
The United States begins the year with elections looming. Depending on who you ask, the world as we know it may cease to exist. To the contrary, we believe the end of the world is far from near; however, as we approach November 3rd, we would like to provide some context to the race and identify key issues and industries that could be most affected by the outcome.
The below table shows the breakdown of party control and returns of the S&P 500 for each Congress since 1945. The reader will draw their own conclusions from the data, but it is objectively difficult to tell what effect (if any) party control has on the stock market. The sample sizes are too small, and it is impossible to pin the causes of returns purely on the administration in charge.
For instance, during the 107th congress (2001-2003), the S&P 500 declined 29.2%. This time-period coincided with the collapse of the dotcom bubble, as well as 9/11. Pinning this on the George W. Bush administration or the tumultuous control of the Senate requires leaps of logic we aren’t willing to make.
Or take the market collapse during the great recession, which took place during the 110th congress (2007-2009). Surely the newly minted Democratic control of Congress can’t be blamed for the real estate collapse. The collapse was developing long before they were elected.
The three occurrences of total Republican control do have the largest mean returns; however, the sample size is too small to draw conclusions. Furthermore, stock market performance under split administrations and Democratic control is solid, and an investor wouldn’t want to sit on the sidelines merely because they do not favor the party in control.
Our take: do not solely rely on partisan rhetoric pertaining to market booms or busts. Stay focused on the long term and don’t let fear mongering win the day
| Congress (Years) | House | Senate | President | S&P 500 |
| 79th (1945–1947) | D | D | D- Roosevelt/Truman |
14.0% |
| 80th (1947–1949) | R | R | D- Truman |
0.0% |
| 81st (1949–1951) | D | D | D- Truman |
36.6% |
| 82nd (1951–1953) | D | D | D- Truman |
27.8% |
| 83rd (1953–1955) | R | Split | R – Eisenhower |
37.2% |
| 84th (1955–1957) | D | D | R – Eisenhower |
28.1% |
| 85th (1957–1959) | D | D | R – Eisenhower |
18.8% |
| 86th (1959–1961) | D | D | R – Eisenhower |
4.8% |
| 87th (1961–1963) | D | D | D- Kennedy |
11.4% |
| 88th (1963–1965) | D | D | D- Kennedy/Johnson |
30.9% |
| 89th (1965–1967) | D | D | D- Johnson |
-2.3% |
| 90th (1967–1969) | D | D | D- Johnson |
25.5% |
| 91st (1969–1971) | D | D | R – Nixon |
-9.8% |
| 92nd (1971–1973) | D | D | R – Nixon |
27.2% |
| 93rd (1973–1975) | D | D | R – Nixon/Ford |
-41.1% |
| 94th (1975–1977) | D | D | R – Ford |
52.4% |
| 95th (1977–1979) | D | D | D- Carter |
-6.6% |
| 96th (1979–1981) | D | D | D- Carter |
36.4% |
| 97th (1981–1983) | D | R | R – Reagan |
3.2% |
| 98th (1983–1985) | D | R | R – Reagan |
17.6% |
| 99th (1985–1987) | D | R | R – Reagan |
52.5% |
| 100th (1987–1989) | D | D | R – Reagan |
10.1% |
| 101st (1989–1991) | D | D | R – Bush |
17.5% |
| 102nd (1991–1993) | D | D | R – Bush |
33.4% |
| 103rd (1993–1995) | D | D | D- Clinton |
5.5% |
| 104th (1995–1997) | R | R | D- Clinton |
62.8% |
| 105th (1997–1999) | R | R | D- Clinton |
66.5% |
| 106th (1999–2001) | R | R | D- Clinton |
3.1% |
| 107th (2001–2003) | R | Split | R – W. Bush |
-27.6% |
| 108th (2003–2005) | R | R | R – W. Bush |
29.4% |
| 109th (2005–2007) | R | R | R – W. Bush |
17.8% |
| 110th (2007–2009) | D | D | R – W. Bush |
-34.5% |
| 111th (2009–2011) | D | D | D- Obama |
37.0% |
| 112th (2011–2013) | R | D | D- Obama |
15.1% |
| 113th (2013–2015) | R | D | D- Obama |
38.2% |
| 114th (2015–2017) | R | R | D- Obama |
10.8% |
| 115th (2017–2019) | R | R | R – Trump |
12.1% |
*, Source: house.gov, senate.gov, Bloomberg
| Summary Statistics |
| Occurrences | 2-Yr Arithmetic Avg. Ann. Geometric Avg. | |
| All Data | 37 | 17.9% |
| R-R-R | 3 | 19.8% |
| D-D-D | 11 | 19.7% |
| Split | 23 | 16.8% |
Approval for President Trump is hovering around 40%, as it has for nearly his entire presidency. If his goal is reelection, we believe he needs a strong economy to do so. This will be his greatest talking point heading into election – especially against his more left-leaning contenders who want to massively overhaul the U.S. government.
Historically, incumbents with strong economies win elections. We are currently in the midst of the longest economic expansion in U.S. history. Consumer confidence has been above its historical average throughout Trump’s presidencyi. Jobs are consistently being createdii. The S&P 500 is at or near all-time highs. If an election were held tomorrow and the economy were the only issue, the incumbent would likely win with ease. In fact, all three of Moody’s economy-based election models predict a Trump electoral win in 2020iii.
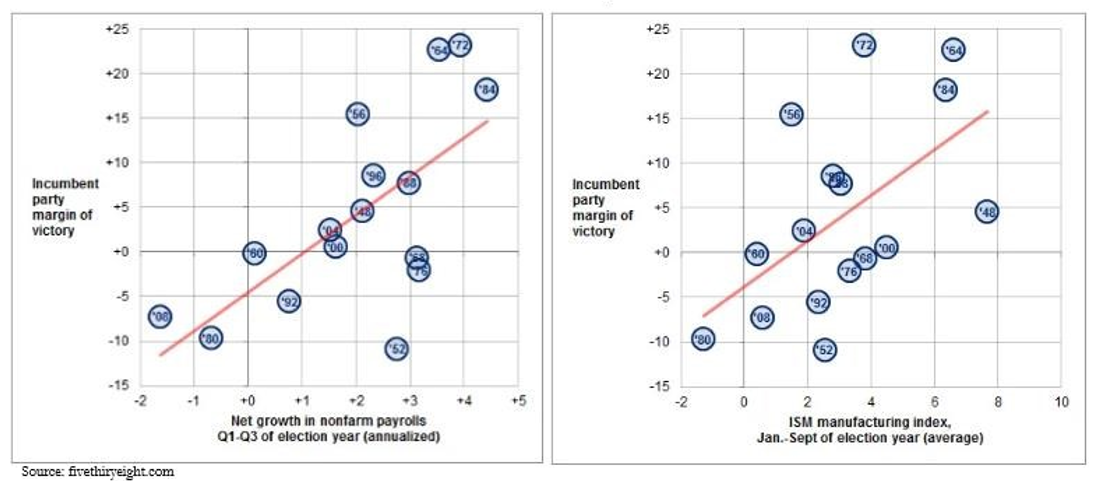
The one major blip in the economy in recent months has been the ISM manufacturing index, which has shown some weakness in the industrial sector. This has been attributed to uncertainty regarding U.S. trade policies. “Phase One” of a U.S.-China trade deal was announced in early December and is reported to be a first step in resolving the nearly two-year-old trade war between the two countries. This has provided some relief for markets, but by no means is the trade dispute over. There remain U.S. tariffs on $350 Billion of Chinese goods. China is expected to meet many demands regarding purchases of U.S. goods, intellectual property rights, and some financial system reforms.
It is by no means impossible that Phase One doesn’t hold up, and the U.S. resumes its tariffs on Chinese goods. However, it is more likely that the trade tensions ease or stay roughly the same going into November due to the need for the administration to support the economy. The trade war is continuously mentioned as being among the largest concerns of business leaders, so continued negotiations and improved outlook could be a catalyst for businesses to increase capital outlays. Should the negotiations reverse course and we see further escalation in the conflict, it would create confusion in the business environment and potentially knock a strong economy off stride.
Adding to the incentive to improve trade relations is the impact tariffs have on key swing states:
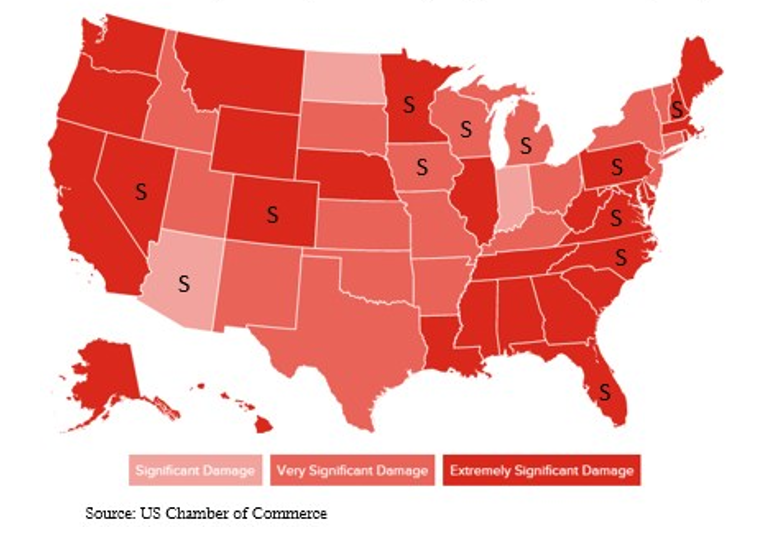
Trump needs to win these swing states to remain president in 2021. He and his team realize this and therefore are unlikely to inflame trade tensions with China heading into November.
There is only so much that a president can do to alter the economy and markets. However, the incentives indicate that the current administration will likely show progress in talks with China in the next year in order to support the economy and markets.
Every election appears to be the most important election that we can remember; the current election being no exception. Perhaps that seems contradictory to earlier statements, but there will be opportunities and risks in specific areas of the market, given the proposals that many of the current candidates have floated.
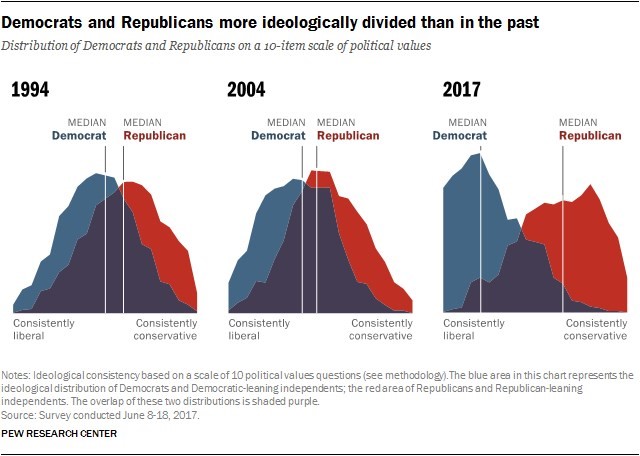
There is evidence to say that Americans have become more divided and partisan than ever beforeiv:
This is apparent in some of the policies proposed by candidates and will ultimately be reflected in the competitive environment and market. Calls for increased regulation and more heavy-handed government intervention in the economy will create winners and losers.
We identify the following as areas to watch in the coming months:
Policy proposal: Significantly higher minimum wage
Opportunity: This may seem like a death knell for companies reliant on minimum and low-wage labor. Restaurants (especially fast food) and retail both employ low wage workers. However, these regulations may (in the long run) help larger enterprises with economies of scale, access to capital, and a willingness to invest in technology. Sammy’s diner might not be able to afford an increase in labor expenses without hiking prices, but the mega franchise down the street can develop new ways to automate restaurant processes and decrease headcount, which has already begun to take shape at the mega chains. As such, they can now keep prices low and outcompete the local shops on price, widening their competitive advantage.
Policy proposal: A ban on fracking
Opportunity: The fear of a swift transition from fossil fuels to “greener” energy sources has depressed valuation multiples for Oil & Gas companies. A ban on fracking could reduce the United States’ oil production and potentially create a catalyst for energy companies with minimal exposure to fracking plays to benefit from the lower supply of oil on the market. Combined with already-low valuations, this could be a boon for these companies’ stock prices. Governments around the world have announced plans to reduce fossil fuel usage, but in the meantime we are still reliant on these fuels to power our lives.
It will be up to money managers to allocate capital in a way that makes sense for the business environment.
Our global strategy will continue to aid us in finding opportunities regardless of geography and political climate. If policies are implemented that will negatively impact businesses and markets, we will adjust our positioning accordingly.
As always, the key to our strategy will be selectivity. While the broad market will react to various events that will unfold in the next ten months, we will continue to seek pockets of opportunity which have better risk/reward characteristics. We do not hold ourselves out to be election forecasters. However, it is prudent to evaluate the effects that government policies can have on a company’s value.
Certain statements made by us may be forward-looking statements and projections which describe our strategies, goals, outlook, expectations, or projections. These statements are only predictions and involve known and unknown risks, uncertainties, and other factors that may cause actual results to differ materially from those expressed or implied by such forward-looking statements. Data has been obtained from sources which we deem reliable but are in no way guaranteed by us as to their accuracy.
i https://data.oecd.org/leadind/consumer–confidence–index–cci.htm.
ii https://www.bls.gov/web/empsit/cps_charts.pdf
iii https://www.moodysanalytics.com/–/media/article/2019/president–election–model.pdf
iv https://www.people–press.org/2017/10/05/1–partisan–divides–over–political–values–widen/
*Returns are price returns. Returns are calculated using the last closing price prior to a Congress’s tenure to the last closing price during a Congress’s tenure. “President” is the president in power during the majority of a congress’s tenure. Control during the 83rd and 107th Senate shifted parties multiple times.