

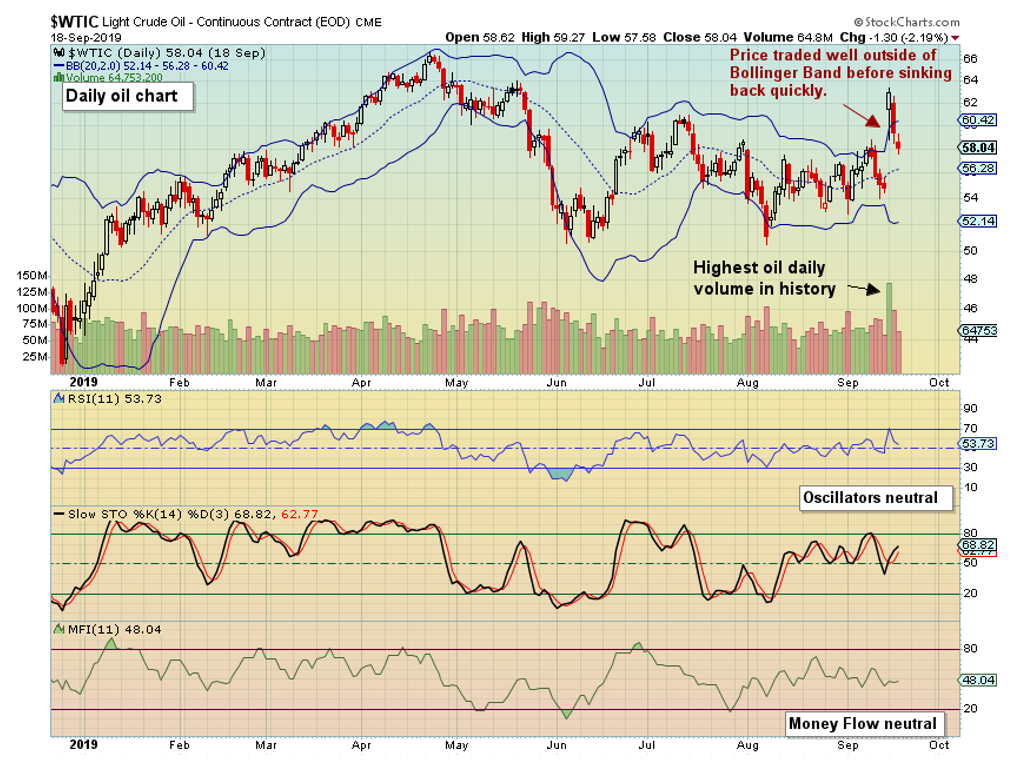
As you’ve read and seen already, Saturday’s attack on Saudi Arabia’s oil facilities, including a processing plant, is the largest disruption to oil supply that the markets and world have seen in recent times. An estimated 5.7 million barrels of crude oil per day of supply were affected. Oil futures markets opened Sunday to the largest surge in crude prices in more than a decade and the greatest price advance in Brent oil in 28 years. Daily volume was the highest ever recorded for crude oil by Monday’s close. The over-extended portion of the price spike was short-lived. Updates from Saudi Arabia have included an optimistic outlook for restoring operations, and the EIA reported that the U.S. domestic crude stockpiles rose again. However, crude is still trading roughly 7% higher from where it closed last Friday.
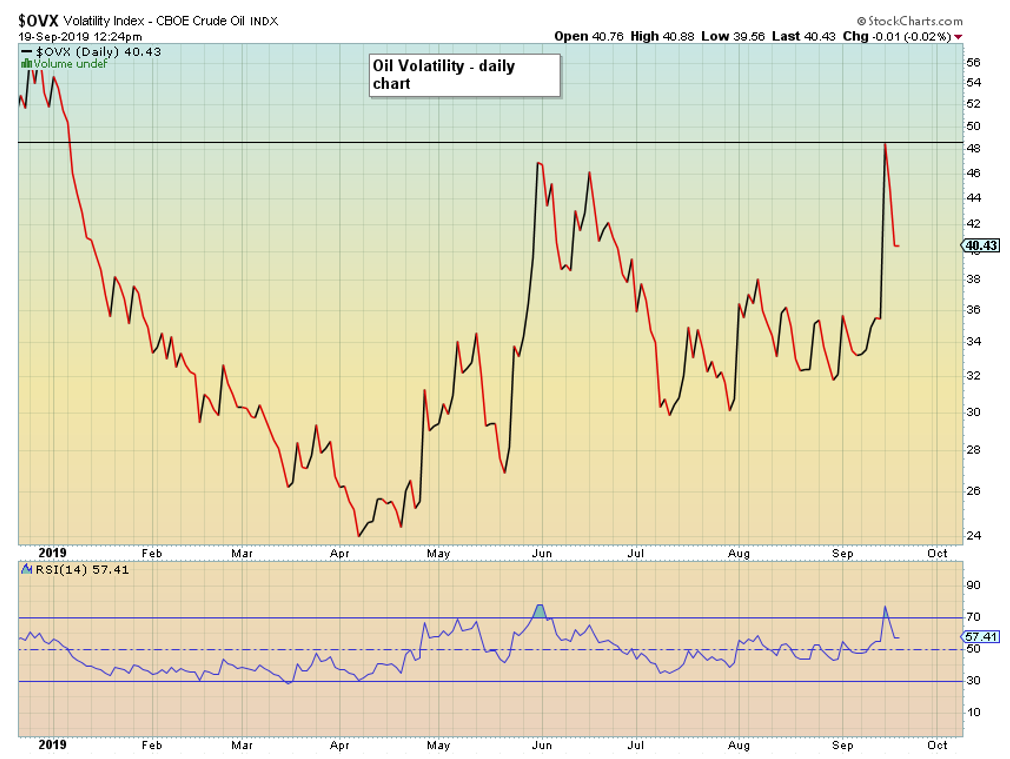
At 48%, oil volatility had its highest close since January. This volatility spike also quickly retraced — back into the low 40’s — however it is still at an elevated level.
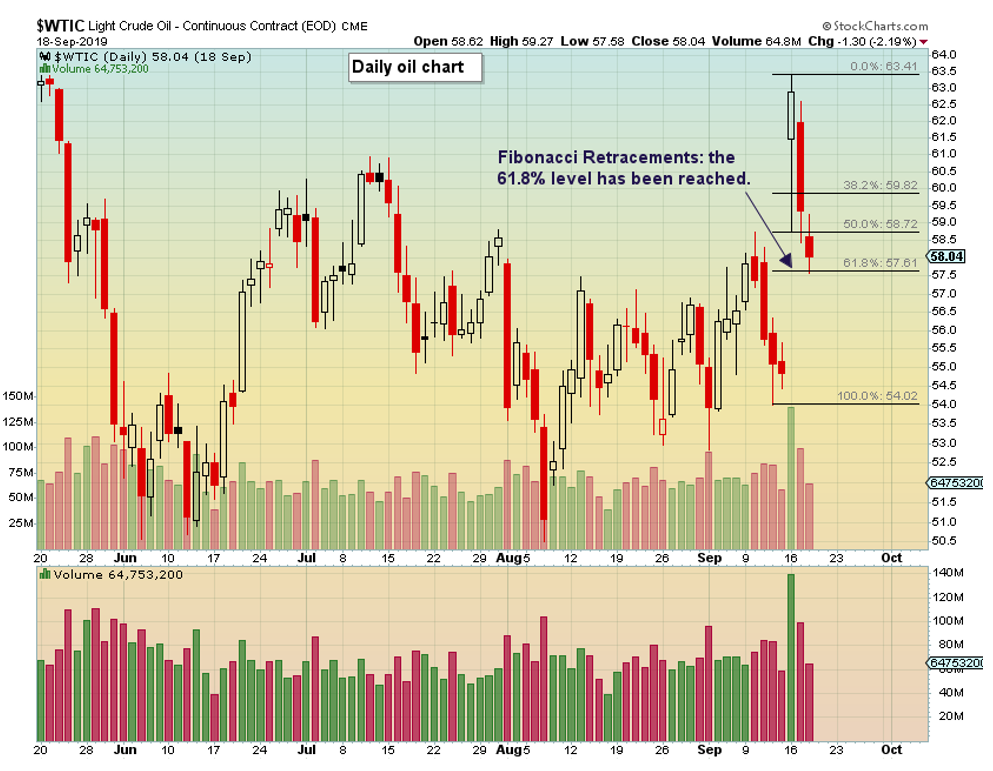
Since the crude oil futures markets opened on Sunday night and price reached over $63, price currently is trading near $58.50. The 61.8% Fibonacci Retracement level was reached at $57.61. This level should be watched for a break or bounce. If it breaks below, one could anticipate a full retracement of price to the 100% Fibonacci level, back where price started, near $54.
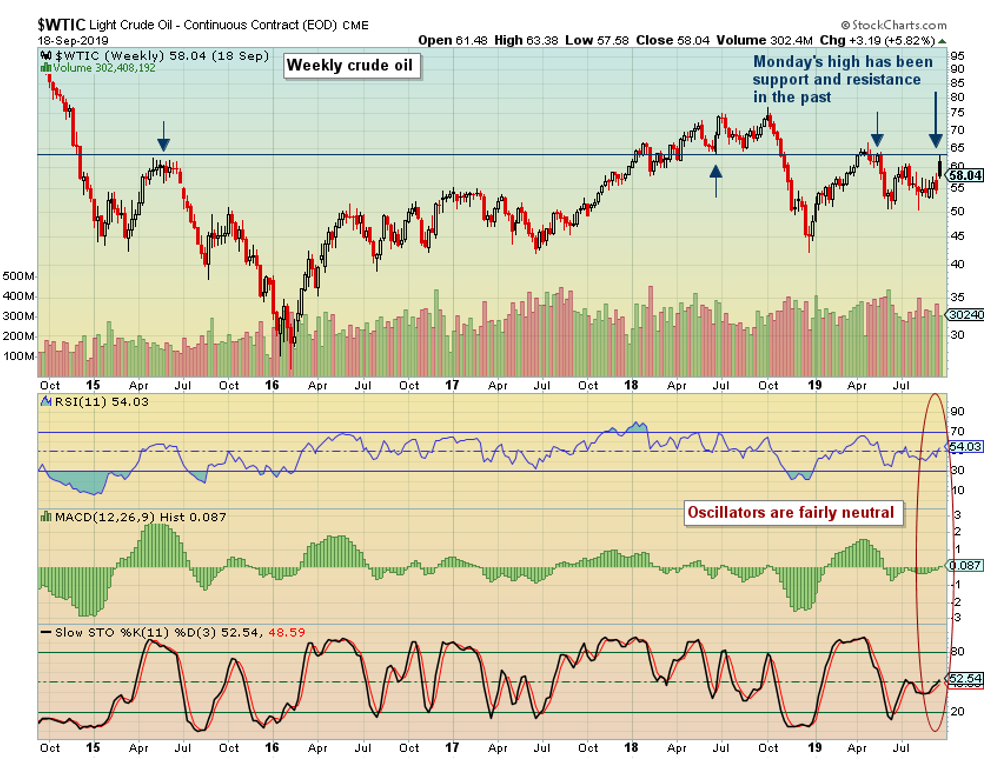
When looking for resistance levels, the price high seen this week met a line of support and resistance areas that have been tested multiple times since 2015 (weekly chart below). The oscillators of RSI, MACD, and Slow Stochastics are all fairly neutral, as price was not able to break out to new highs.
Oscillators are also neutral on the monthly time frame. On the monthly 20-year monthly chart below, I’ve drawn support and resistance lines. I always find it interesting how resistances can turn into supports and vice-versa. The price high on Sunday night is near a 20-year support/resistance line that has been tested numerous times over the past two decades (bright blue line).

More trendlines can be drawn to demonstrate tighter ranges however, I think it’s important to look at “The Big Picture” occasionally. Personally, the $40 to $80 range stands out to me. Clearly, that is a range big enough to drive a bus through, but I also think it gives us information. For instance, without a defined trend, trading direction could be difficult. Trying to pick highs and lows, then reversing is a difficult trading strategy. A neutral area though could appeal to option or option spread traders, especially with this higher level of volatility present.
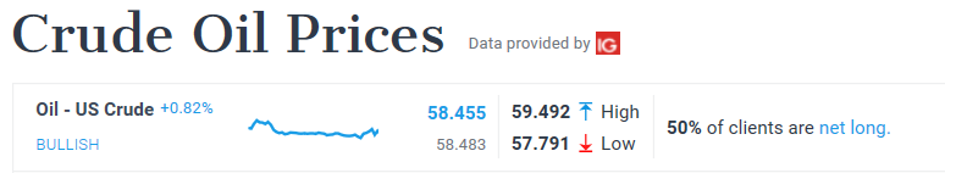
The last item to indicate that oil prices are in an area of neutrality is a screenshot from DailyFX.com and IG. The data shows the percentage of their futures clients that are long or short certain markets. Taken this morning, they show that 50% of their clients are net long. It can’t get more neutral than that.
I find reviewing the array of charts through various time periods to be a useful exercise, especially when daily price swings are so wide. If you trade oil, hopefully you have found some use for the charts also.
Disclosure: Kimberly Rios hold both long and short oil positions in the commodity fund that she manages.