Do the Crude Charts Match the News?

It’s hard to ignore all of the talk and articles about oil having a $100 target. That’s a significantly higher amount from where it trades now at roughly $72. The daily and weekly charts are filled with information. They can help guide in where resistance may be along with way as well as give other indications. A breakdown of the daily and weekly charts are below.

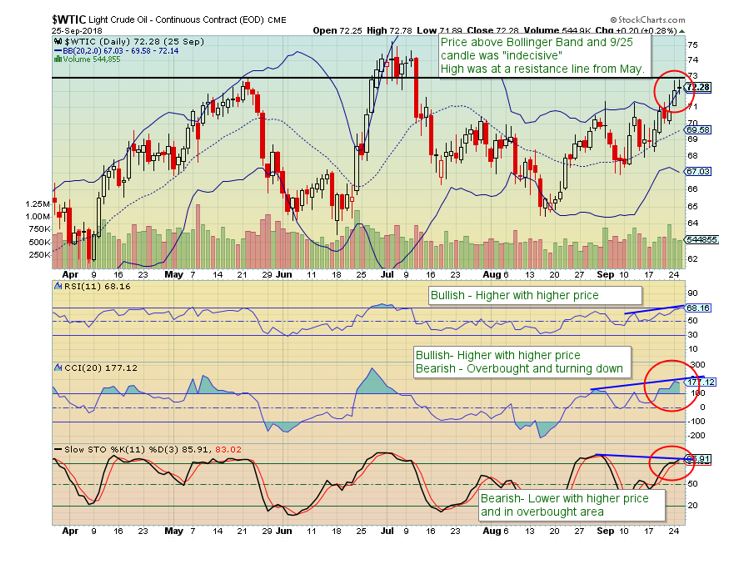
Daily Chart (as of 9/25/18)

-Price above Bollinger Band

-“Indecisive” candlestick after a 6.5% move in 5 days (low to high)

-Recent high is at resistance from May

-CCI and Slow Stochastics Oscillators in overbought territory

-RSI near overbought and at a high level overall

-Slow stochastics shows divergence – lower oscillator peaks with higher price peaks

-RSI and CCI have followed price – higher oscillator highs with higher prices

—These last 2 items are conflict with each other.
Weekly Chart

-Resistance level from 2011 & 2012 was recently touched and price retraced

-The 61.8% Fibonacci retracement level from the 2014-2016 move matches the above resistance line

-Volume has been decreasing on the move higher

-Oscillator divergence – Lower highs when price has been making higher highs
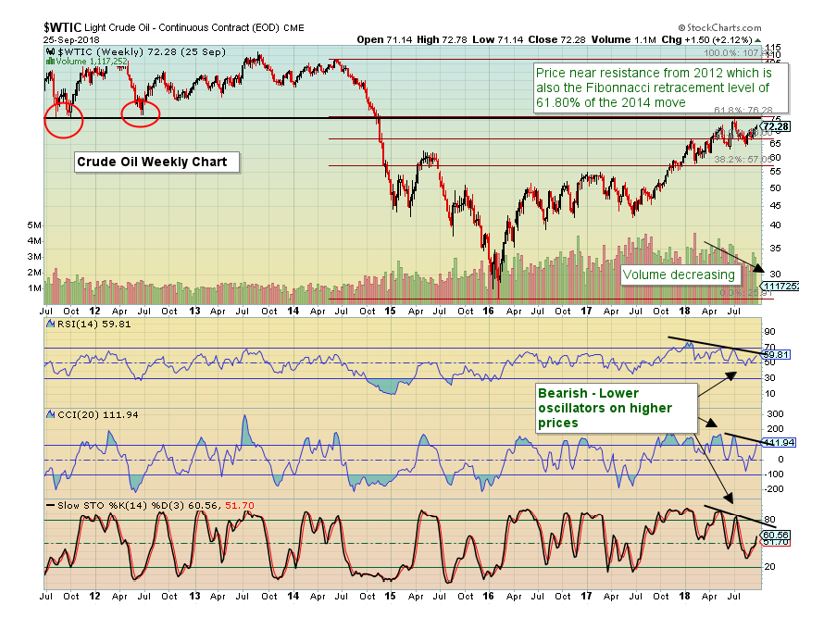
In summary, the daily chart has some conflicting items but shows the resistance line near $73. If this breaks and stays above, it’s time to revisit the charts for the next higher price targets. However when referring to the weekly chart, bearish signals are present.

The post Do the Crude Charts Match the News? appeared first on Catalyst Hedged Commodity Strategy Fund Blog.

Latest

A Summer Surge: August 2024 HANDLS Monthly Report

After a challenging July that saw investors sell off high-flying technology stocks, buyers returned to the market in August, bidding up risk assets across the board.

Where are the Hidden Risks in Your Portfolio Currently? Plus, an idea.

Allocators add new exposures for a variety of reasons; diversification, returns, risk mitigation, etc. Understanding this, what is the most over-owned and expensive sector today?

Consumer Spending: Are Consumers Tapped Out or Pushing Back?

Consumer Spending: Are Consumers Tapped Out or Pushing Back?  Key...

Knocked Down Inflation: July 2024 HANDLS Monthly Report

After a red-hot June built on expectations that the Federal Reserve may succeed at killing inflation without killing the economy, July saw investors begin to question the soft-landing narrative.

Newsletter

Don't miss

A Summer Surge: August 2024 HANDLS Monthly Report

After a challenging July that saw investors sell off high-flying technology stocks, buyers returned to the market in August, bidding up risk assets across the board.

Where are the Hidden Risks in Your Portfolio Currently? Plus, an idea.

Allocators add new exposures for a variety of reasons; diversification, returns, risk mitigation, etc. Understanding this, what is the most over-owned and expensive sector today?

Consumer Spending: Are Consumers Tapped Out or Pushing Back?

Consumer Spending: Are Consumers Tapped Out or Pushing Back?  Key...

Knocked Down Inflation: July 2024 HANDLS Monthly Report

After a red-hot June built on expectations that the Federal Reserve may succeed at killing inflation without killing the economy, July saw investors begin to question the soft-landing narrative.

Carry Traders Get Carried Out

It looks like a big margin call started in Japan. The Japanese Yen has become a funding currency in recent years, a source of cheap financing with the proceeds reinvested in better returning assets – such as US$ listed AI stocks.
Kimberly Rios, CFA, CMT, Portfolio Manager
Kimberly Rios joined Catalyst Capital Advisors as a Portfolio Manager in 2014. She is currently a Portfolio Manager of an options-based commodity fund at Catalyst Funds. She carries the Series 3 license, the Chartered Financial Analyst (CFA) Designation, the Chartered Market Technician (CMT) designation, and is a member of the National Futures Association. Ms. Rios has degrees in Economics and Finance from the University of Arizona.

A Summer Surge: August 2024 HANDLS Monthly Report

After a challenging July that saw investors sell off high-flying technology stocks, buyers returned to the market in August, bidding up risk assets across the board.

Where are the Hidden Risks in Your Portfolio Currently? Plus, an idea.

Allocators add new exposures for a variety of reasons; diversification, returns, risk mitigation, etc. Understanding this, what is the most over-owned and expensive sector today?

Consumer Spending: Are Consumers Tapped Out or Pushing Back?

Consumer Spending: Are Consumers Tapped Out or Pushing Back?  Key Summary: Sentiment towards the consumer and spending is about as negative as I’ve seen. Assets...